Overview
CodeSync is a developer-focused code analysis platform that goes beyond basic static analysis by transforming raw code structure into actionable engineering insights. It parses JavaScript/TypeScript repositories, builds dependency graphs, and performs advanced analyses such as impact detection, circular dependency identification, and complexity scoring.
Problem faced by developers
Modern codebases grow fast—and they grow messy even faster. As projects scale, understanding how different parts of the system interact becomes increasingly difficult.
One of the core issues is lack of visibility into code relationships. Files depend on each other in ways that aren’t obvious by just reading them. Circular dependencies can silently creep in, making the system fragile and harder to maintain.
In short -
- Developers struggle to understand unfamiliar codebases quickly
- Architectural issues like circular dependencies and deep coupling go unnoticed
- There’s no simple way to visualize and measure code complexity at a structural level
What I Built to solve this problem
I built a CLI-driven static analysis tool for JavaScript and TypeScript projects that focuses on understanding code structure rather than syntax.
At a high level, the tool scans a given repository, parses source files into an AST using Babel, and extracts import/export relationships to construct a dependency graph. This graph becomes the foundation for further analysis.
On top of this, I implemented a set of analysis layers:
- Cycle detection using graph traversal to identify circular dependencies
- Dependency depth calculation to understand how deeply nested a module is
- Impact analysis to trace which files are affected by changes in a given module
- Basic complexity scoring based on dependency relationships
- Analysis of codebase using AI
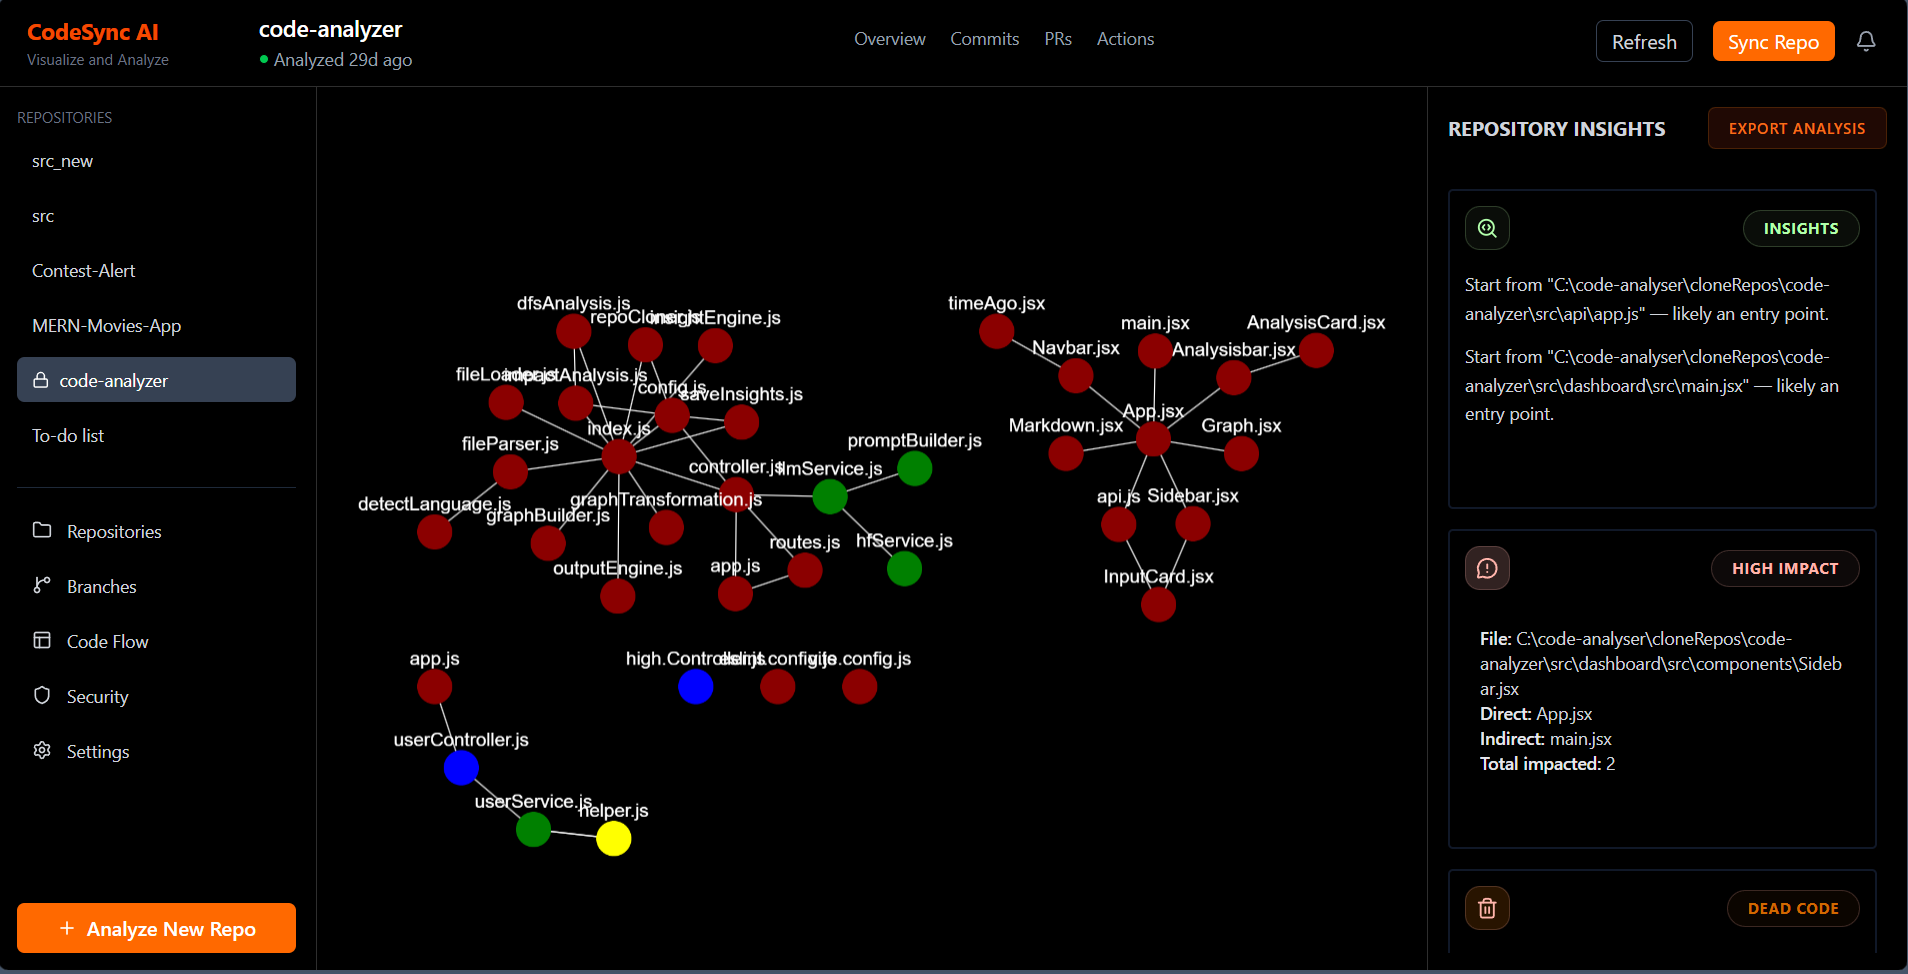
The CLI outputs structured insights and also feeds a local dashboard where the graph can be visualized and explored interactively. Nodes represent files, and edges represent dependencies, making it easier to reason about coupling and architecture.
Architecture
The system is designed as a CLI-first analysis pipeline with a modular backend and a lightweight visualization layer. Each component has a single responsibility: extract structure, analyze relationships, and expose insights.
 Architecture Diagram
CLI Layer (Entry Point)
The CLI acts as the orchestrator. It accepts a project path, recursively scans files, and triggers the analysis pipeline.
- Handles file discovery (.js, .ts, .jsx, .tsx)
- Filters unsupported files early to avoid parser crashes
- Passes normalized file paths to the analysis engine
This layer is intentionally thin — its job is coordination, not computation.
Parsing & Analysis Engine
This is the core of the system.
Uses @babel/parser to convert source files into ASTs Traverses AST to extract:
- Import declarations
- Export relationships
- Builds a dependency map (adjacency list representation)
Graph Engine
The dependency map is transformed into a graph structure where:
Nodes → files Edges → import relationships
On top of this graph:
- Cycle Detection
- Implemented using DFS with recursion stack tracking
- Dependency Depth
- Longest path calculation from entry nodes
- Impact Analysis
- Reverse traversal to find affected modules
- Complexity Scoring
- Derived from in-degree, out-degree, and depth
All computations are done in-memory for speed.
Backend API Layer
A lightweight Node.js + Express server exposes analysis results.
- Serves precomputed insights (JSON) Provides endpoints for:
- File-level impact analysis
- Complexity queries
- Decouples computation from visualization
This separation allows the CLI to remain usable independently.
Visualization Layer (Dashboard)
A local React-based dashboard renders the graph interactively.
Uses Cytoscape.js for graph visualization Nodes are styled based on:
- Complexity
- Cycle presence
- Clicking a node triggers:
- Impact analysis request
- Detailed metrics view
The goal is not aesthetics, but fast structural understanding.
Challenges & Failures
This project wasn’t straightforward. Most of the complexity came from dealing with real-world code, not controlled examples.
1. AST Parsing Breaks on Real Repos
Initial implementation assumed all files were clean .js/.ts. In practice, repos contain mixed file types, incomplete configs, and syntax variations.
- Issue: Babel parser crashing on unsupported or malformed files
- Fix: Added strict file filtering + safe parsing with fallback handling to prevent pipeline failure
2. Infinite Recursion in Cycle Detection
The first DFS implementation for cycle detection caused a maximum call stack exceeded error.
- Issue: Recursive traversal without proper visited/stack tracking
- Fix: Implemented recursion stack tracking (visited + inStack) to correctly detect cycles without infinite loops
3. Dependency Graph Inconsistencies
Building a reliable graph wasn’t trivial. Import paths vary (relative paths, aliases, missing extensions).
- Issue: Broken edges and incomplete graph
- Fix: Normalized file paths and resolved imports before graph construction
4. Performance Constraints
Naive implementations worked on small projects but slowed down as file count increased.
- Issue: Recomputing graph operations repeatedly
- Fix: Shifted to in-memory caching and avoided redundant traversals
Most problems weren’t algorithmic—they were about handling real-world edge cases, inconsistent data, and system boundaries.
Future Improvements
The current system focuses on structural analysis, but there’s room to push it further toward actionable intelligence rather than just raw insights.
1. Smarter LLM-Based Code Insights (Already Implemented, Needs Refinement)
Basic LLM integration is in place to summarize analysis data (cycles, complexity, impact). Next step is improving signal quality:
- Reduce generic outputs → make insights context-aware
- Map insights to specific files instead of global summaries
- Combine graph metrics + code snippets for better explanations
2. Entry Point Detection (Automatic)
Right now, analysis is file-agnostic. Improvement:
- Detect entry files (index.js, main.ts, etc.)
- Use them as roots for more accurate depth and impact analysis
3. Multi-Language Support
The system is limited to JS/TS. Expansion:
- Add support for other ecosystems (Python, Java)
- Abstract parsing layer instead of tightly coupling with Babel
4. Incremental Analysis (Performance Upgrade)
Currently, the tool scans the entire codebase on every run. Improvement:
- Cache previous results
- Re-analyze only changed files
- Reduce runtime for large projects
5. CI/CD Integration
Move from local tool → workflow tool
- Run analysis in pull requests
- Fail builds on high complexity or circular dependencies
- Track architectural health over time
6. Plugin System / Extensibility
Allow custom analysis modules:
- Users define their own rules (e.g., forbidden imports)
- Extend beyond built-in metrics
7. Better Graph Intelligence
Current graph is structural. Next step:
- Detect “hotspots” (high impact + high complexity)
- Highlight architectural bottlenecks automatically
Direction
The goal is to evolve from a static analyzer → decision-support tool that not only shows structure, but also helps developers take action on it.